
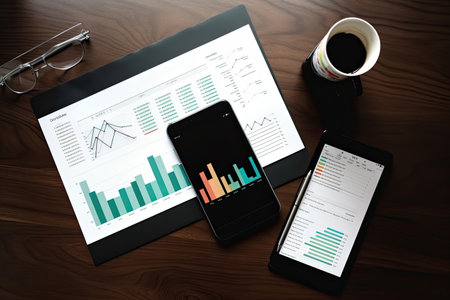
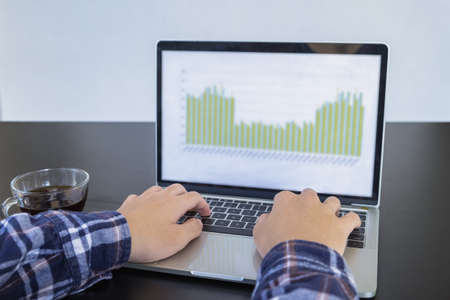
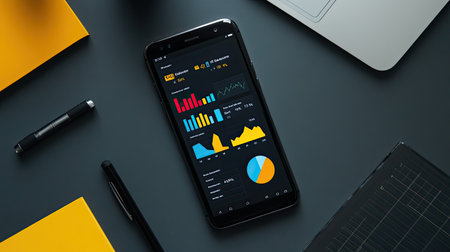
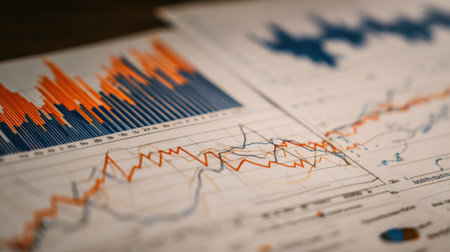
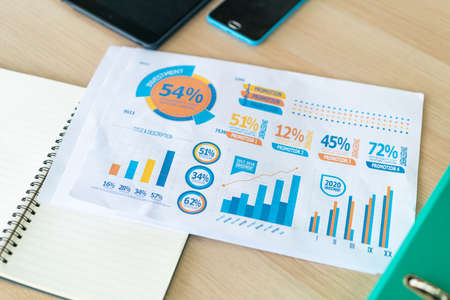
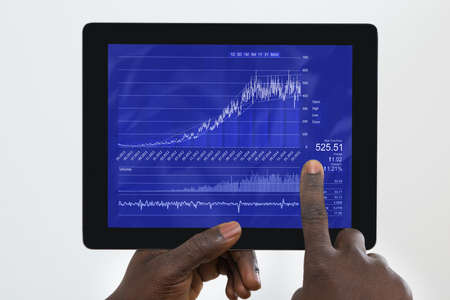
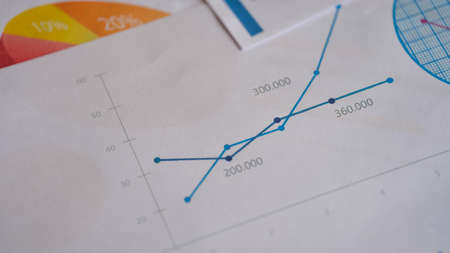
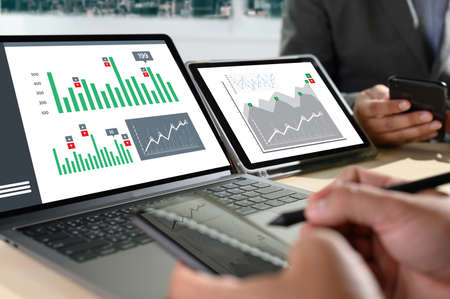
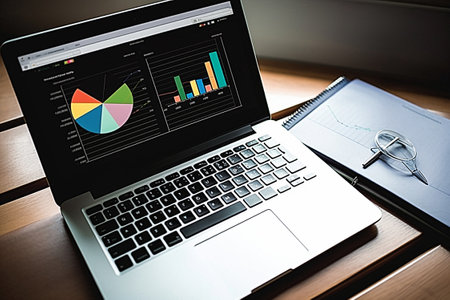
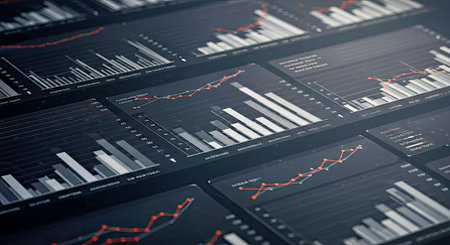
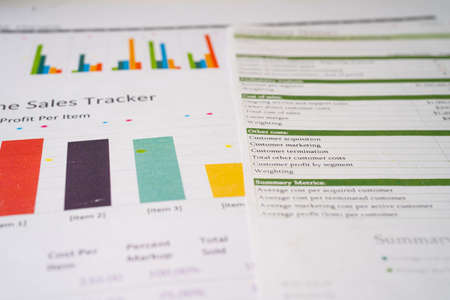
Smartphone and Tablet pc with financial charts and graphs on office desk, business concept
Коллекция по умолчанию
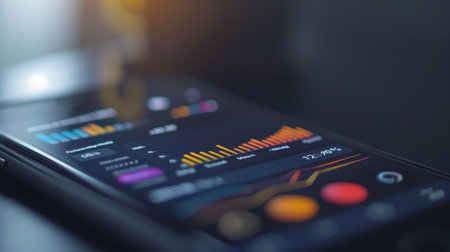
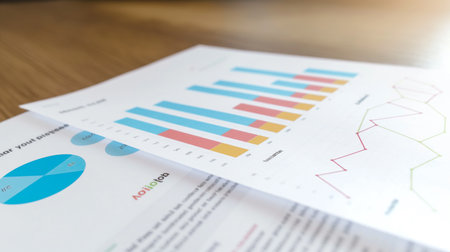
Коллекция по умолчанию
Создать новую
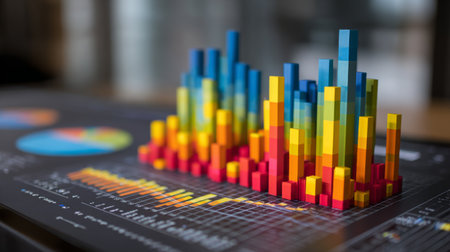
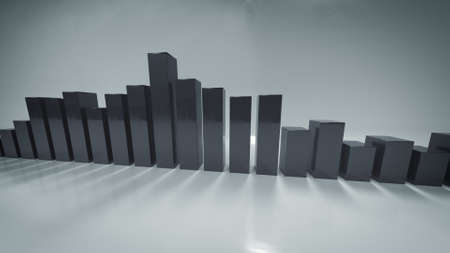
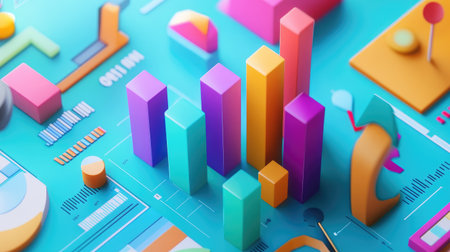
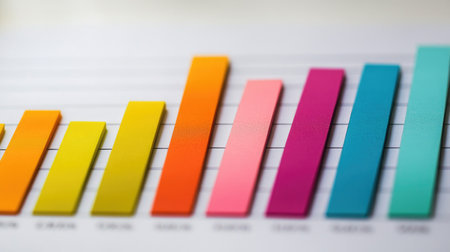
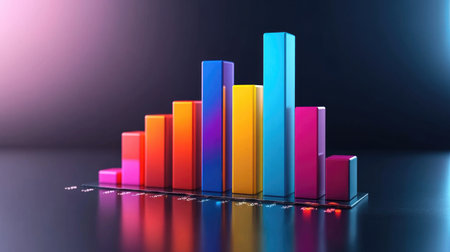
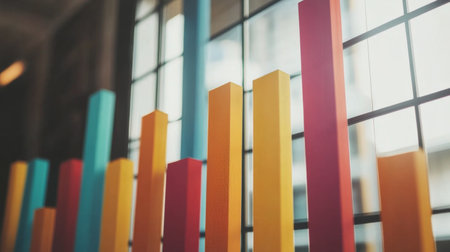
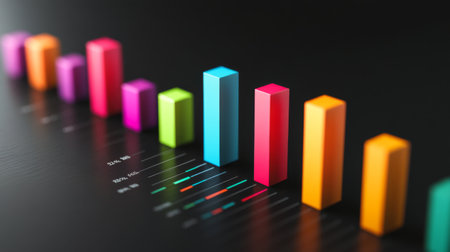
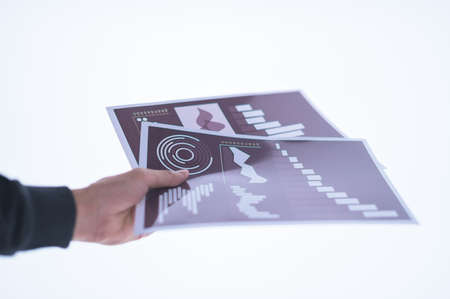
Vibrant 3D bar chart sits on a digital workspace, showcasing data analysis. The image represents growth, trends, and technology in modern business presentations.
Коллекция по умолчанию
Коллекция по умолчанию
Создать новую
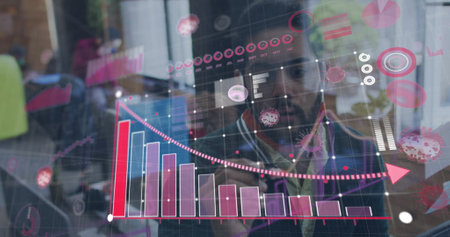
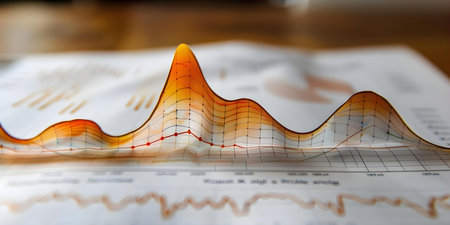
Image of statistics recording and covid 19 cells over man drawing in office wearing face mask. global covid 19 pandemic, health and medicine concept digitally generated image.
Коллекция по умолчанию
Коллекция по умолчанию
Создать новую
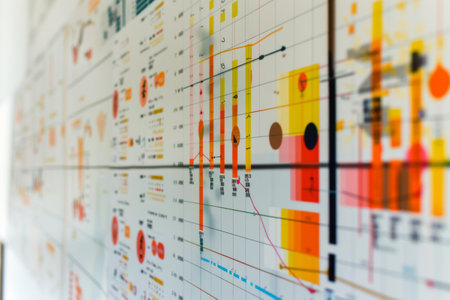
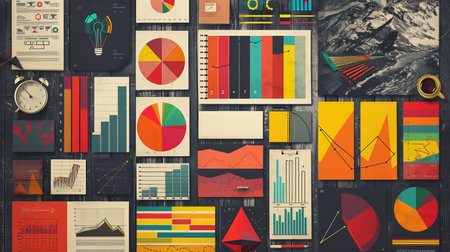
A timeline chart showing events and milestones over time AI generated
Коллекция по умолчанию
Коллекция по умолчанию
Создать новую
Smartphone and Tablet pc with financial charts and graphs on office desk, business concept
Коллекция по умолчанию
Коллекция по умолчанию
Создать новую
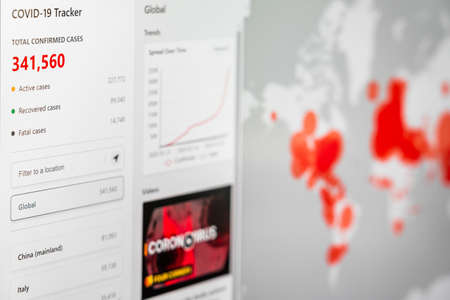
BUCHAREST, ROMANIA - MARCH 23, 2020: Coronavirus Total Cases Of The Pandemic Spreading All Around The Globe In March
Коллекция по умолчанию
Коллекция по умолчанию
Создать новую
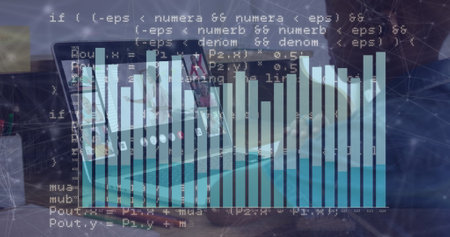
Image of data processing over diverse schoolchildren having image call. Global education and digital interface concept digitally generated image.
Коллекция по умолчанию
Коллекция по умолчанию
Создать новую
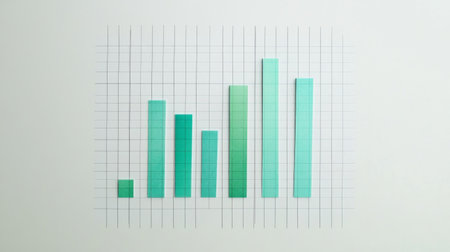
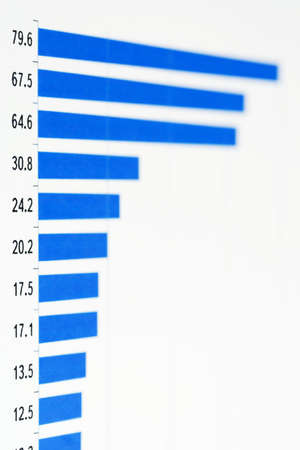
A financial bar chart showing comparison of investment returns, with green bars rising sharply to symbolize growth, displayed against a white background with grid lines.
Коллекция по умолчанию
Коллекция по умолчанию
Создать новую

A colorful 3D bar graph rising dramatically on a reflective surface, symbolizing growth and success in business performance metrics.
Коллекция по умолчанию
Коллекция по умолчанию
Создать новую
Learn online, Student watching lesson online and studying from home. Young man taking notes while looking at computer screen following professor on video call. Studying from home on pc.
Коллекция по умолчанию
Коллекция по умолчанию
Создать новую
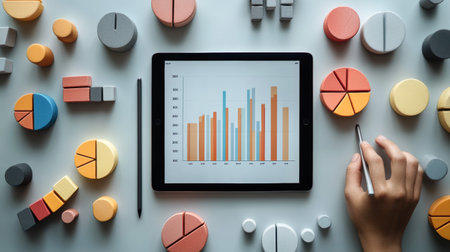
Digital tablet displaying bar charts surrounded by colorful 3D pie charts and blocks. Represents data analysis, business insights, and analytics
Коллекция по умолчанию
Коллекция по умолчанию
Создать новую
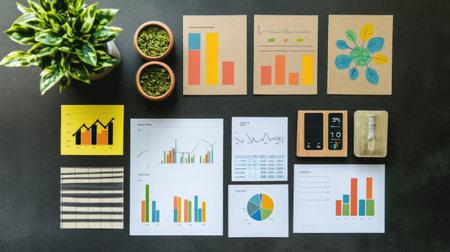
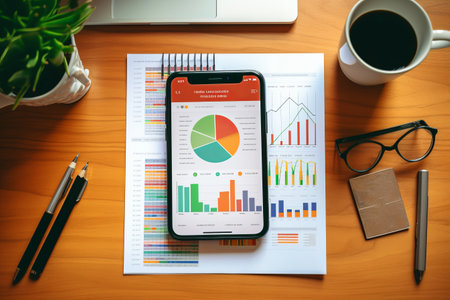
A visually engaging workspace featuring colorful charts and graphs alongside planters, ideal for presentations, data analysis, and professional brainstorming sessions.
Коллекция по умолчанию
Коллекция по умолчанию
Создать новую
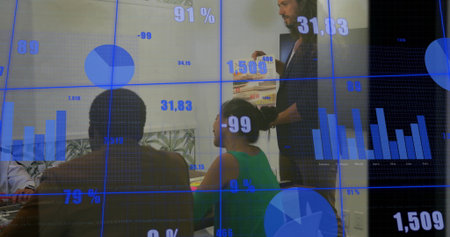
An office worker shows his colleagues a presentation with a company development graph at night on the company's computer
Коллекция по умолчанию
Коллекция по умолчанию
Создать новую

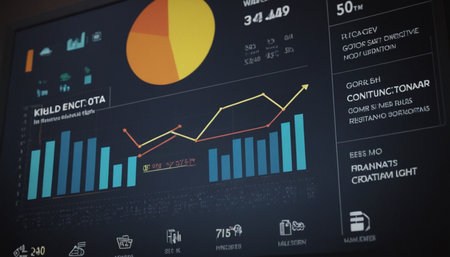
A close-up of a digital dashboard with rising investments, offering space for adding content about investment performance, growth, or risk management
Коллекция по умолчанию
Коллекция по умолчанию
Создать новую
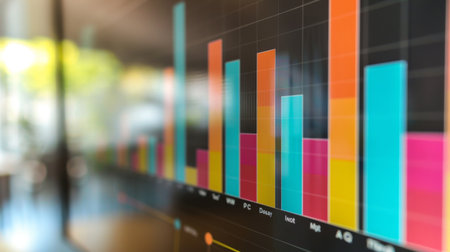
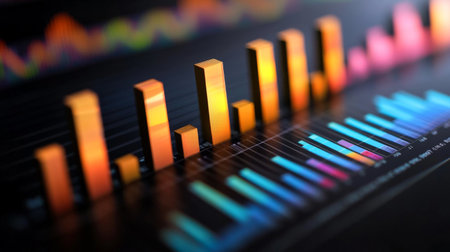
Vibrant bar graph displayed on a digital screen, showcasing data insights and trends for business analysis. Ideal for presentations and reports.
Коллекция по умолчанию
Коллекция по умолчанию
Создать новую
graph chart of stock market investment trading.
Коллекция по умолчанию
Коллекция по умолчанию
Создать новую

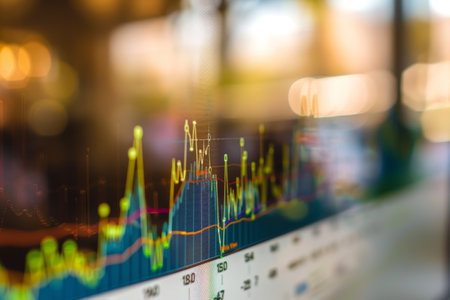
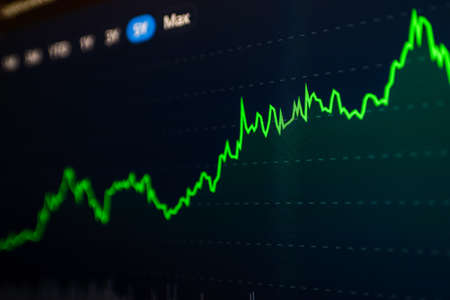
Stock market graph on screen. Ticker on monitor screen. Investing, Finance and Economic concept. Shallow depth of field.
Коллекция по умолчанию
Коллекция по умолчанию
Создать новую
A close-up of a financial dashboard with growth charts and profit reports, providing space to add insights on economic growth, investment strategies, or market expansion
Коллекция по умолчанию
Коллекция по умолчанию
Создать новую

Displaying translucent financial chart overlay across studio walls, with framed artworks. Art, gallery, decor, investment, analytics, creative, contemporary
Коллекция по умолчанию
Коллекция по умолчанию
Создать новую
A flat lay of a smartphone with digital graphs and charts on the screen, with ample copy space.
Коллекция по умолчанию
Коллекция по умолчанию
Создать новую
Medium shot of a closeup on charts and graphs illustrating loan interest rate fluctuations over time
Коллекция по умолчанию
Коллекция по умолчанию
Создать новую

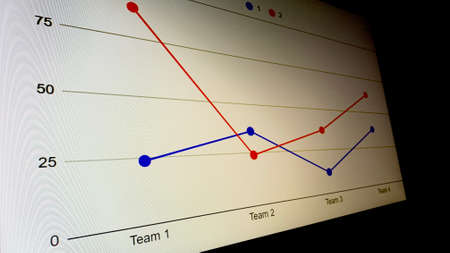
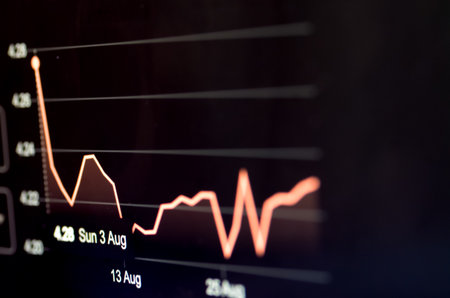
Shallow depth of field (selective focus) with details of a chart showing the stock market crash from March 2020 due to the Covid-19 pandemic on a computer screen (S&P500 index)
Коллекция по умолчанию
Коллекция по умолчанию
Создать новую

A statistical report with a diagram lies on the table
Коллекция по умолчанию
Коллекция по умолчанию
Создать новую
Gray bars of spectrum analyzer with reflection. Abstract music concept. 3D render illustration
Коллекция по умолчанию
Коллекция по умолчанию
Создать новую
Analyzing Stock Market Trends and Investment Opportunities: A Detailed Financial Chart. Concept Stock Market Trends, Investment Opportunities, Financial Charts, Analysis, Detailed Insights
Коллекция по умолчанию
Коллекция по умолчанию
Создать новую
Collage background visual of various business scenes. Management strategy.
Коллекция по умолчанию
Коллекция по умолчанию
Создать новую
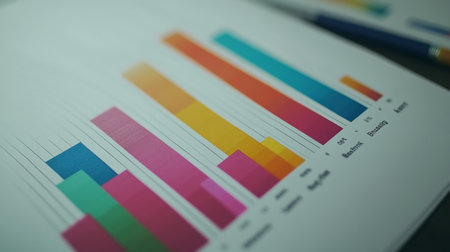
close-up business graph paper on working table
Коллекция по умолчанию
Коллекция по умолчанию
Создать новую
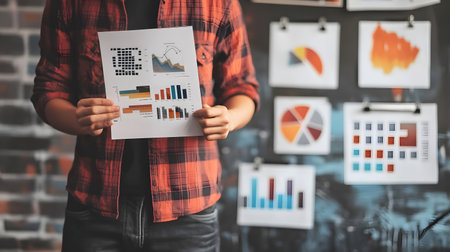
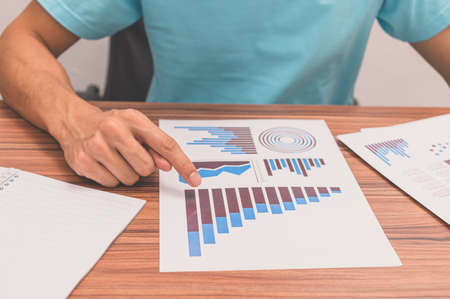
Person in a casual plaid shirt holding a printed data analysis report with bar charts and graphs, standing in front of a wall covered with business analytics charts.
Коллекция по умолчанию
Коллекция по умолчанию
Создать новую
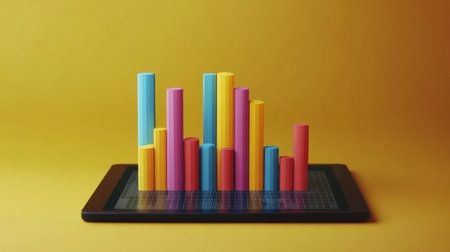
A vibrant 3D bar graph displayed on a tablet against a bright yellow background, illustrating data analysis and modern business growth concepts.
Коллекция по умолчанию
Коллекция по умолчанию
Создать новую
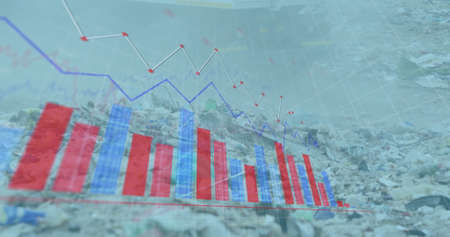
Image of financial data processing over a garbage dump. Digitalinterface global finance and business concept digitally generated image.
Коллекция по умолчанию
Коллекция по умолчанию
Создать новую
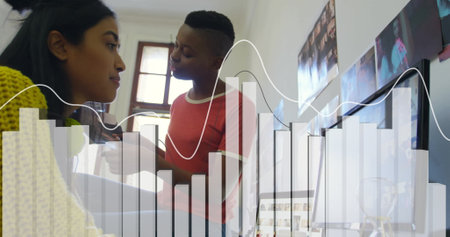
Image of financial data processing over diverse colleagues discussing work in office. Global business, finances and digital interface concept digitally generated image.
Коллекция по умолчанию
Коллекция по умолчанию
Создать новую
Charts Graphs spreadsheet paper. Financial development, Banking Account, Statistics, Investment Analytic research data economy, Stock exchange Business office company meeting concept.
Коллекция по умолчанию
Коллекция по умолчанию
Создать новую
People take view business growth graphs
Коллекция по умолчанию
Коллекция по умолчанию
Создать новую
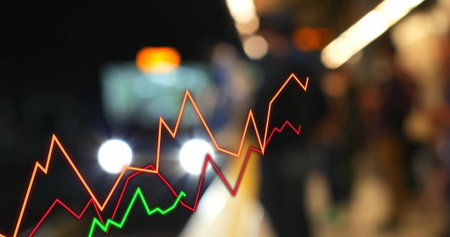
Waiting commuter wearing dark coat on night station platform, oncoming headlights. Urban, transit, public, transportation, night
Коллекция по умолчанию
Коллекция по умолчанию
Создать новую
This image showcases a colorful bar graph that visualizes data insights for business analysis. The vibrant colors highlight various metrics and trends.
Коллекция по умолчанию
Коллекция по умолчанию
Создать новую

Strategic Insights: A Wooden Canvas of Business Growth Analytics
Коллекция по умолчанию
Коллекция по умолчанию
Создать новую
An infographic-style image displaying a vibrant D bar chart alongside various data points, with arrows and percentages, illustrating the impact of marketing strategies on company growth.
Коллекция по умолчанию
Коллекция по умолчанию
Создать новую
Digitally generated image of financial charts and graphs against black background
Коллекция по умолчанию
Коллекция по умолчанию
Создать новую
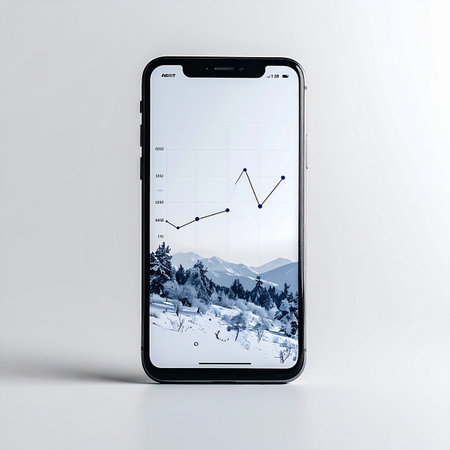
A smartphone displays a rising financial graph against a backdrop of a stark, snowy mountain range.
Коллекция по умолчанию
Коллекция по умолчанию
Создать новую

Image of data processing over landscape. Global digital interface technology and connections concept digitally generated image.
Коллекция по умолчанию
Коллекция по умолчанию
Создать новую
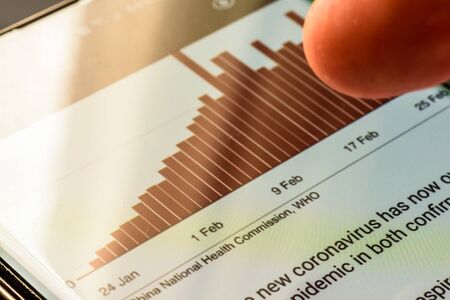
coronavirus covid 19 graph on smart phone screen - Northampton, UK - February 25, 2020
Коллекция по умолчанию
Коллекция по умолчанию
Создать новую
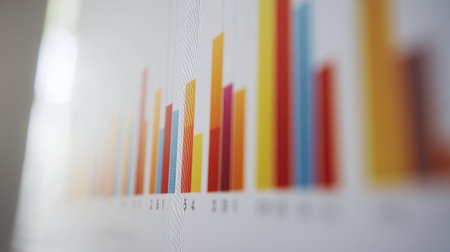
A colorful bar chart representing stock performance over time, with various heights and vibrant colors, set against a clean, professional backdrop.
Коллекция по умолчанию
Коллекция по умолчанию
Создать новую
hazard risk chart
Коллекция по умолчанию
Коллекция по умолчанию
Создать новую
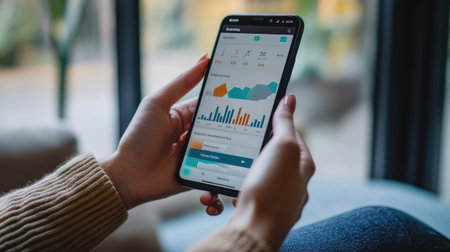
A close-up of hands holding a smartphone with a banking app, showing a financial graph of account balances and transactions.
Коллекция по умолчанию
Коллекция по умолчанию
Создать новую
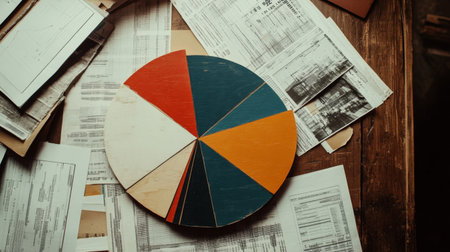
A colorful chart rests on a wooden table surrounded by various documents, showcasing a creative workspace with artistic and analytical elements.
Коллекция по умолчанию
Коллекция по умолчанию
Создать новую
Close-up Of Person's Hand Holding Digital Tablet With Graph On Screen
Коллекция по умолчанию
Коллекция по умолчанию
Создать новую
A close-up of a smartphone screen showing a financial app with graphs tracking investment performance and market trends.
Коллекция по умолчанию
Коллекция по умолчанию
Создать новую
Stunning futuristic data visualization screens featuring vibrant colors and dynamic gradients set against a dark background ideal for business analysis and presentations.
Коллекция по умолчанию
Коллекция по умолчанию
Создать новую
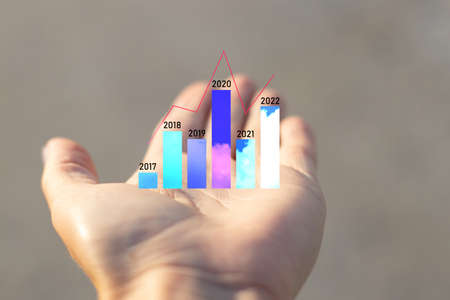
histogram with columns and years in the palm of the hand girl, analysis of years from 2017 to 2022, subview of totals, histogram
Коллекция по умолчанию
Коллекция по умолчанию
Создать новую
Detailed view of a graph displayed on a digital screen, showing trend analysis for website traffic flow, Incorporate trend analysis for website traffic fluctuations
Коллекция по умолчанию
Коллекция по умолчанию
Создать новую

reports and histograms on paper on the table, analytics and statistics on paper, business analytics
Коллекция по умолчанию
Коллекция по умолчанию
Создать новую
Overlapping, translucent area charts in gradient hues on a dark background, creating an elegant, data-rich visual effect
Коллекция по умолчанию
Коллекция по умолчанию
Создать новую
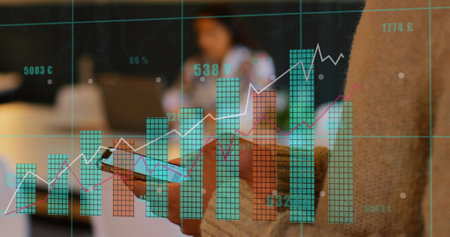
Image of data processing over mid section of african american man using smartphone at office. Business data technology concept
Коллекция по умолчанию
Коллекция по умолчанию
Создать новую
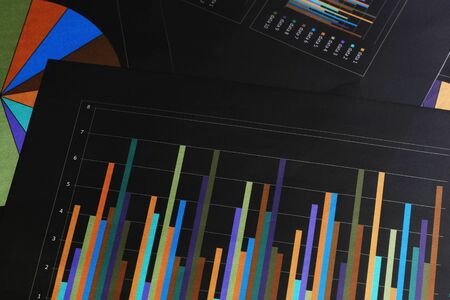
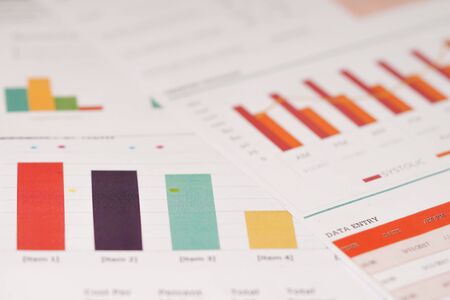
Documents with colourful charts, graphs and diagrams
Коллекция по умолчанию
Коллекция по умолчанию
Создать новую
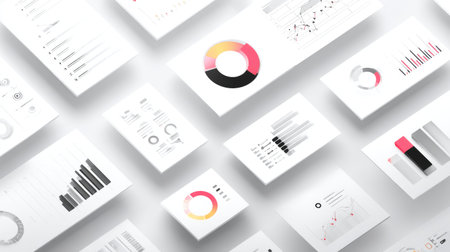
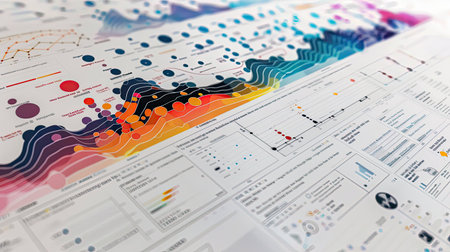
This image features a diverse collection of modern data visualization charts and graphs, ideal for business reports and marketing presentations in a clean layout.
Коллекция по умолчанию
Коллекция по умолчанию
Создать новую
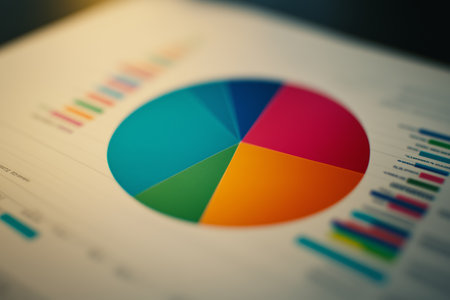
Colorful pie chart on a financial report with data visualizations displayed in a business setting in the afternoon
Коллекция по умолчанию
Коллекция по умолчанию
Создать новую
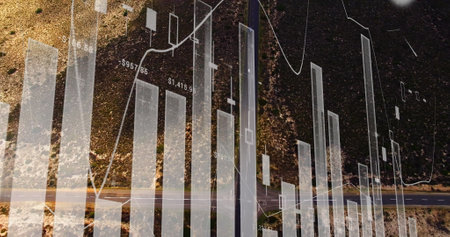
Financial data analysis image over aerial view of road through landscape. Finance, economy, technology, statistics, visualization, graph
Коллекция по умолчанию
Коллекция по умолчанию
Создать новую
Financial Chart Abstract Candlestick Chart with Blue, Orange, Yellow on Dark Background
Коллекция по умолчанию
Коллекция по умолчанию
Создать новую
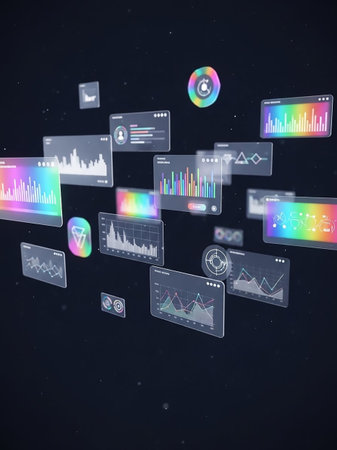
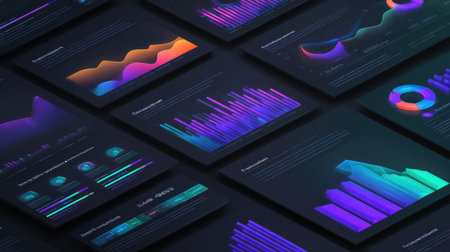
A collection of translucent digital screens displaying colorful charts, graphs, and data visualizations floating in a dark, abstract space.
Коллекция по умолчанию
Коллекция по умолчанию
Создать новую

image is a graph of financial development on a computer monitor.
Коллекция по умолчанию
Коллекция по умолчанию
Создать новую

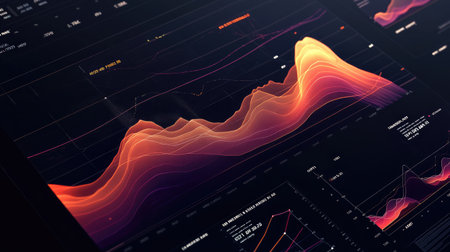
Data graph, retro futuristic visualisation of diagrams and finance graphics, AI generative
Коллекция по умолчанию
Коллекция по умолчанию
Создать новую

chart or graph paper. Financial, account, statistics and business data concept.
Коллекция по умолчанию
Коллекция по умолчанию
Создать новую
Development and growth concept. Businessman plan growth and increase of positive indicators in his business.
Коллекция по умолчанию
Коллекция по умолчанию
Создать новую
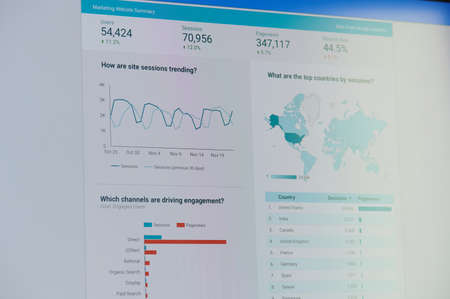
New york, USA - November 24, 2020: Google ads marketing website summarydashboard on laptop screen
Коллекция по умолчанию
Коллекция по умолчанию
Создать новую

Numerical and graphical data simulating a financial study
Коллекция по умолчанию
Коллекция по умолчанию
Создать новую
A detailed view of a bar chart placed on a table, showcasing data through precise and visually appealing bars, A bar chart showing net revenue from various trading platforms, AI Generated
Коллекция по умолчанию
Коллекция по умолчанию
Создать новую
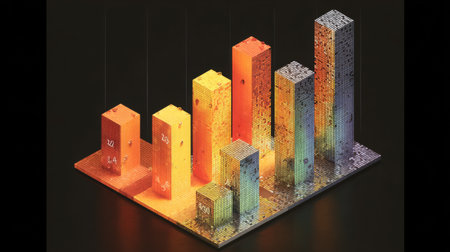
Isometric stacked bar graph in bright colors with a reflective base, representing data analysis and progress tracking
Коллекция по умолчанию
Коллекция по умолчанию
Создать новую
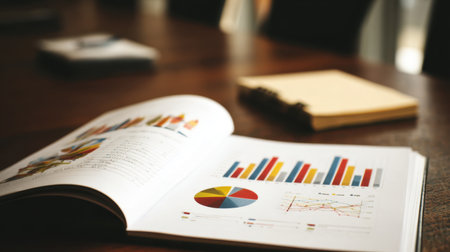
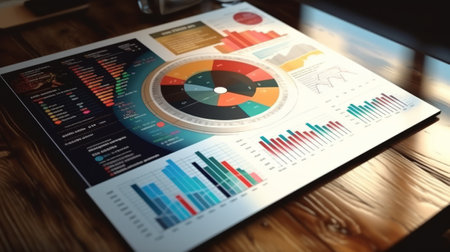
A detailed view of an open business report showcasing colorful graphs and charts on a wooden table, creating a professional workspace atmosphere for analysis and strategy.
Коллекция по умолчанию
Коллекция по умолчанию
Создать новую
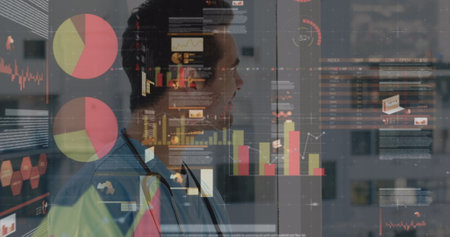
Image of statistics and data processing over male doctor. global medicine, healthcare services, digital interface and technology concept digitally generated image.
Коллекция по умолчанию
Коллекция по умолчанию
Создать новую

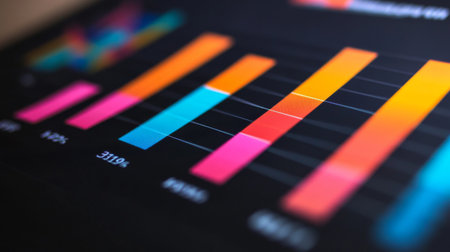
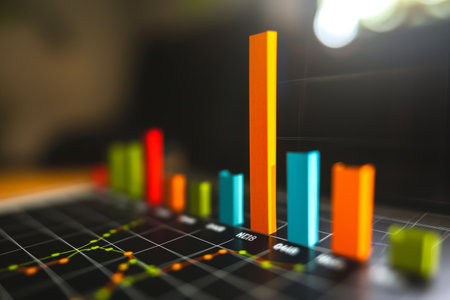
A close-up perspective of numerous vibrant rectangular blocks, primarily red, green, orange, and yellow, arranged on a dark surface marked with a subtle grid pattern. The varying heights of the geometric shapes create a visual representation reminiscent of a bar graph or statistical data. A shallow depth of field keeps certain blocks in sharp focus while others are softly blurred, enhancing the abstract and conceptual nature of the composition. This arrangement evokes themes of data analysis, business trends, market growth, financial reporting, and structured information. The interplay of colorful elements against the dark backdrop provides a modern and dynamic aesthetic, suitable for projects related to finance, technology, or strategic planning.
Коллекция по умолчанию
Коллекция по умолчанию
Создать новую
A professional bar chart with bold, colorful bars rising in front of a clean, minimalist grid background, symbolizing financial performance and growth
Коллекция по умолчанию
Коллекция по умолчанию
Создать новую

Image of connected icons over caucasian man holding coffee cup explaining strategy to coworkers. Digital composite, multiple exposure, communication, beverage, teamwork and planning concept.
Коллекция по умолчанию
Коллекция по умолчанию
Создать новую
Business graphs background.
Коллекция по умолчанию
Коллекция по умолчанию
Создать новую
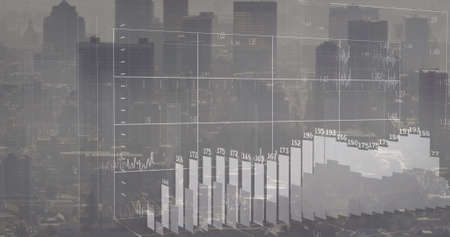
Image of financial data processing over cityscape. global finance, business and digital interface concept digitally generated image.
Коллекция по умолчанию
Коллекция по умолчанию
Создать новую
work hard Data Analytics Statistics Information Business Technology
Коллекция по умолчанию
Коллекция по умолчанию
Создать новую
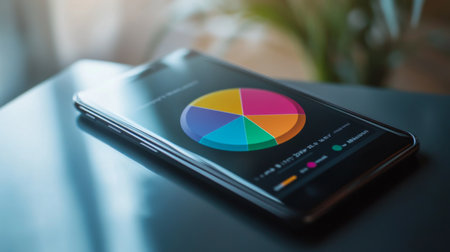
A close-up of a pie chart on a smartphone screen, with vibrant colors and a clear layout for business data visualization on-the-go.
Коллекция по умолчанию
Коллекция по умолчанию
Создать новую
A close-up of a vertical bar chart with varying heights of bars, highlighting trends and comparisons between different data sets with a clean, white background
Коллекция по умолчанию
Коллекция по умолчанию
Создать новую
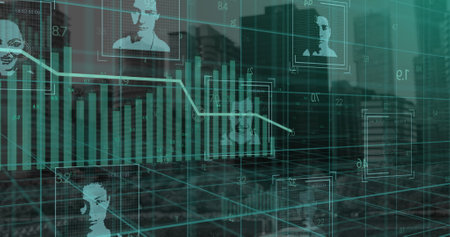
Image of data processing over cityscape. Global online security, business, finance, computing and data processing concept digitally generated image.
Коллекция по умолчанию
Коллекция по умолчанию
Создать новую
Best workplace, laptop and notebook, business concept. Generative AI
Коллекция по умолчанию
Коллекция по умолчанию
Создать новую
financial chart on monitor as concept of stock market data analysis and investment
Коллекция по умолчанию
Коллекция по умолчанию
Создать новую
Efficient Office Productivity: Augmented Reality View of Smart Phone Displaying Charts and Reports on Work Desk
Коллекция по умолчанию
Коллекция по умолчанию
Создать новую
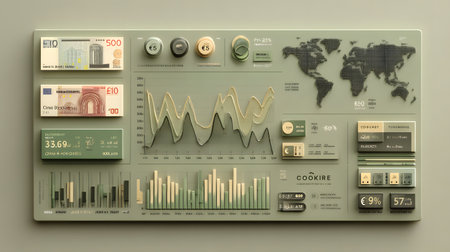
Explore a creative financial data visualization featuring currency notes and detailed charts. Ideal for finance, business, or educational projects.
Коллекция по умолчанию
Коллекция по умолчанию
Создать новую
Business data analysis with charts. Generative AI
Коллекция по умолчанию
Коллекция по умолчанию
Создать новую
A vibrant bar graph on a computer screen, illustrating sales performance over different quarters.
Коллекция по умолчанию
Коллекция по умолчанию
Создать новую
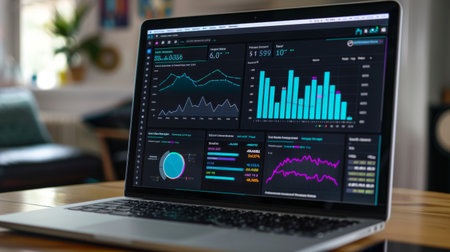
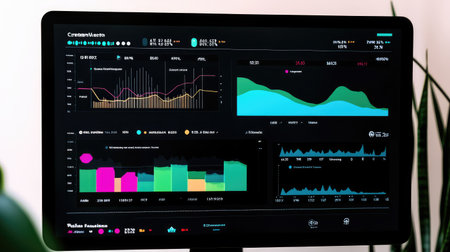
Close-up of a laptop screen with a dashboard displaying various graphs and charts, highlighting data visualization
Коллекция по умолчанию
Коллекция по умолчанию
Создать новую
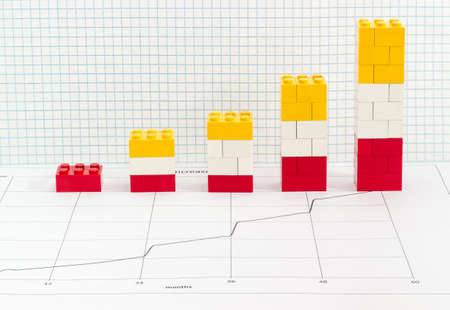
Stacked bar chart with bars which are made from colored plastic parts children's designer on the sheet with line chart against background of squared paper
Коллекция по умолчанию
Коллекция по умолчанию
Создать новую

Close up image of colored wooden blocks as a graph
Коллекция по умолчанию
Коллекция по умолчанию
Создать новую
Presenting team showing product prototype box at conference table, with laptop paperwork and charts. Corporate, collaboration, innovation, analytics, strategy, professional, digital
Коллекция по умолчанию
Коллекция по умолчанию
Создать новую
Charts Graphs paper. Financial development, Banking Account, Statistics, Investment Analytic research data economy, Stock exchange Business office company meeting concept.
Коллекция по умолчанию
Коллекция по умолчанию
Создать новую

Financial graphs and charts analysis
Коллекция по умолчанию
Коллекция по умолчанию
Создать новую
A vibrant 3D bar chart illustration on a dark background, perfect for showcasing data analysis, metrics, and business insights. Ideal for presentations.
Коллекция по умолчанию
Коллекция по умолчанию
Создать новую
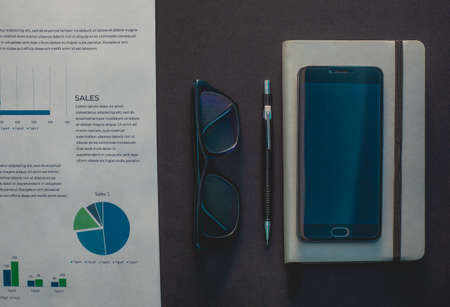
Glasses and phone lie on a black background next to a gray notepad and a sheet with a schedule
Коллекция по умолчанию
Коллекция по умолчанию
Создать новую
Digital Finance: Analyzing Volatile Market Graphs and Managing Tiered Compensation Schedules on a Desktop.
Коллекция по умолчанию
Коллекция по умолчанию
Создать новую
A close-up of a D bar chart showing business growth and financial trends, with a dark gradient background and reflective surfaces for a sleek look.
Коллекция по умолчанию
Коллекция по умолчанию
Создать новую
Grow Stock market trading graph in graphic concept.financial investment or economic trends business design. Abstract finance background.Low angle shot.
Коллекция по умолчанию
Коллекция по умолчанию
Создать новую
This vibrant 3D bar graph offers a striking visualization of data for business analysis, showcasing growth trends and metrics in a modern and engaging format.
Коллекция по умолчанию
Коллекция по умолчанию
Создать новую
Businessman hand holding a document. Scenes white background.
Коллекция по умолчанию
Коллекция по умолчанию
Создать новую

image of the financial graph on a computer monitor.
Коллекция по умолчанию
Коллекция по умолчанию
Создать новую
A close-up view of a blue and black line graph on a white background, showcasing trends and data analysis essential for business reporting and decision-making.
Коллекция по умолчанию
Коллекция по умолчанию
Создать новую
Our profits are on the rise. Shot of paperwork and stationery on a desk in an empty office during the day.
Коллекция по умолчанию
Коллекция по умолчанию
Создать новую
Legion-Media
Создайте свои проекты на основе качественных стоковых фотографий и видео.


Copyright © Legion-Media.